Case Study.
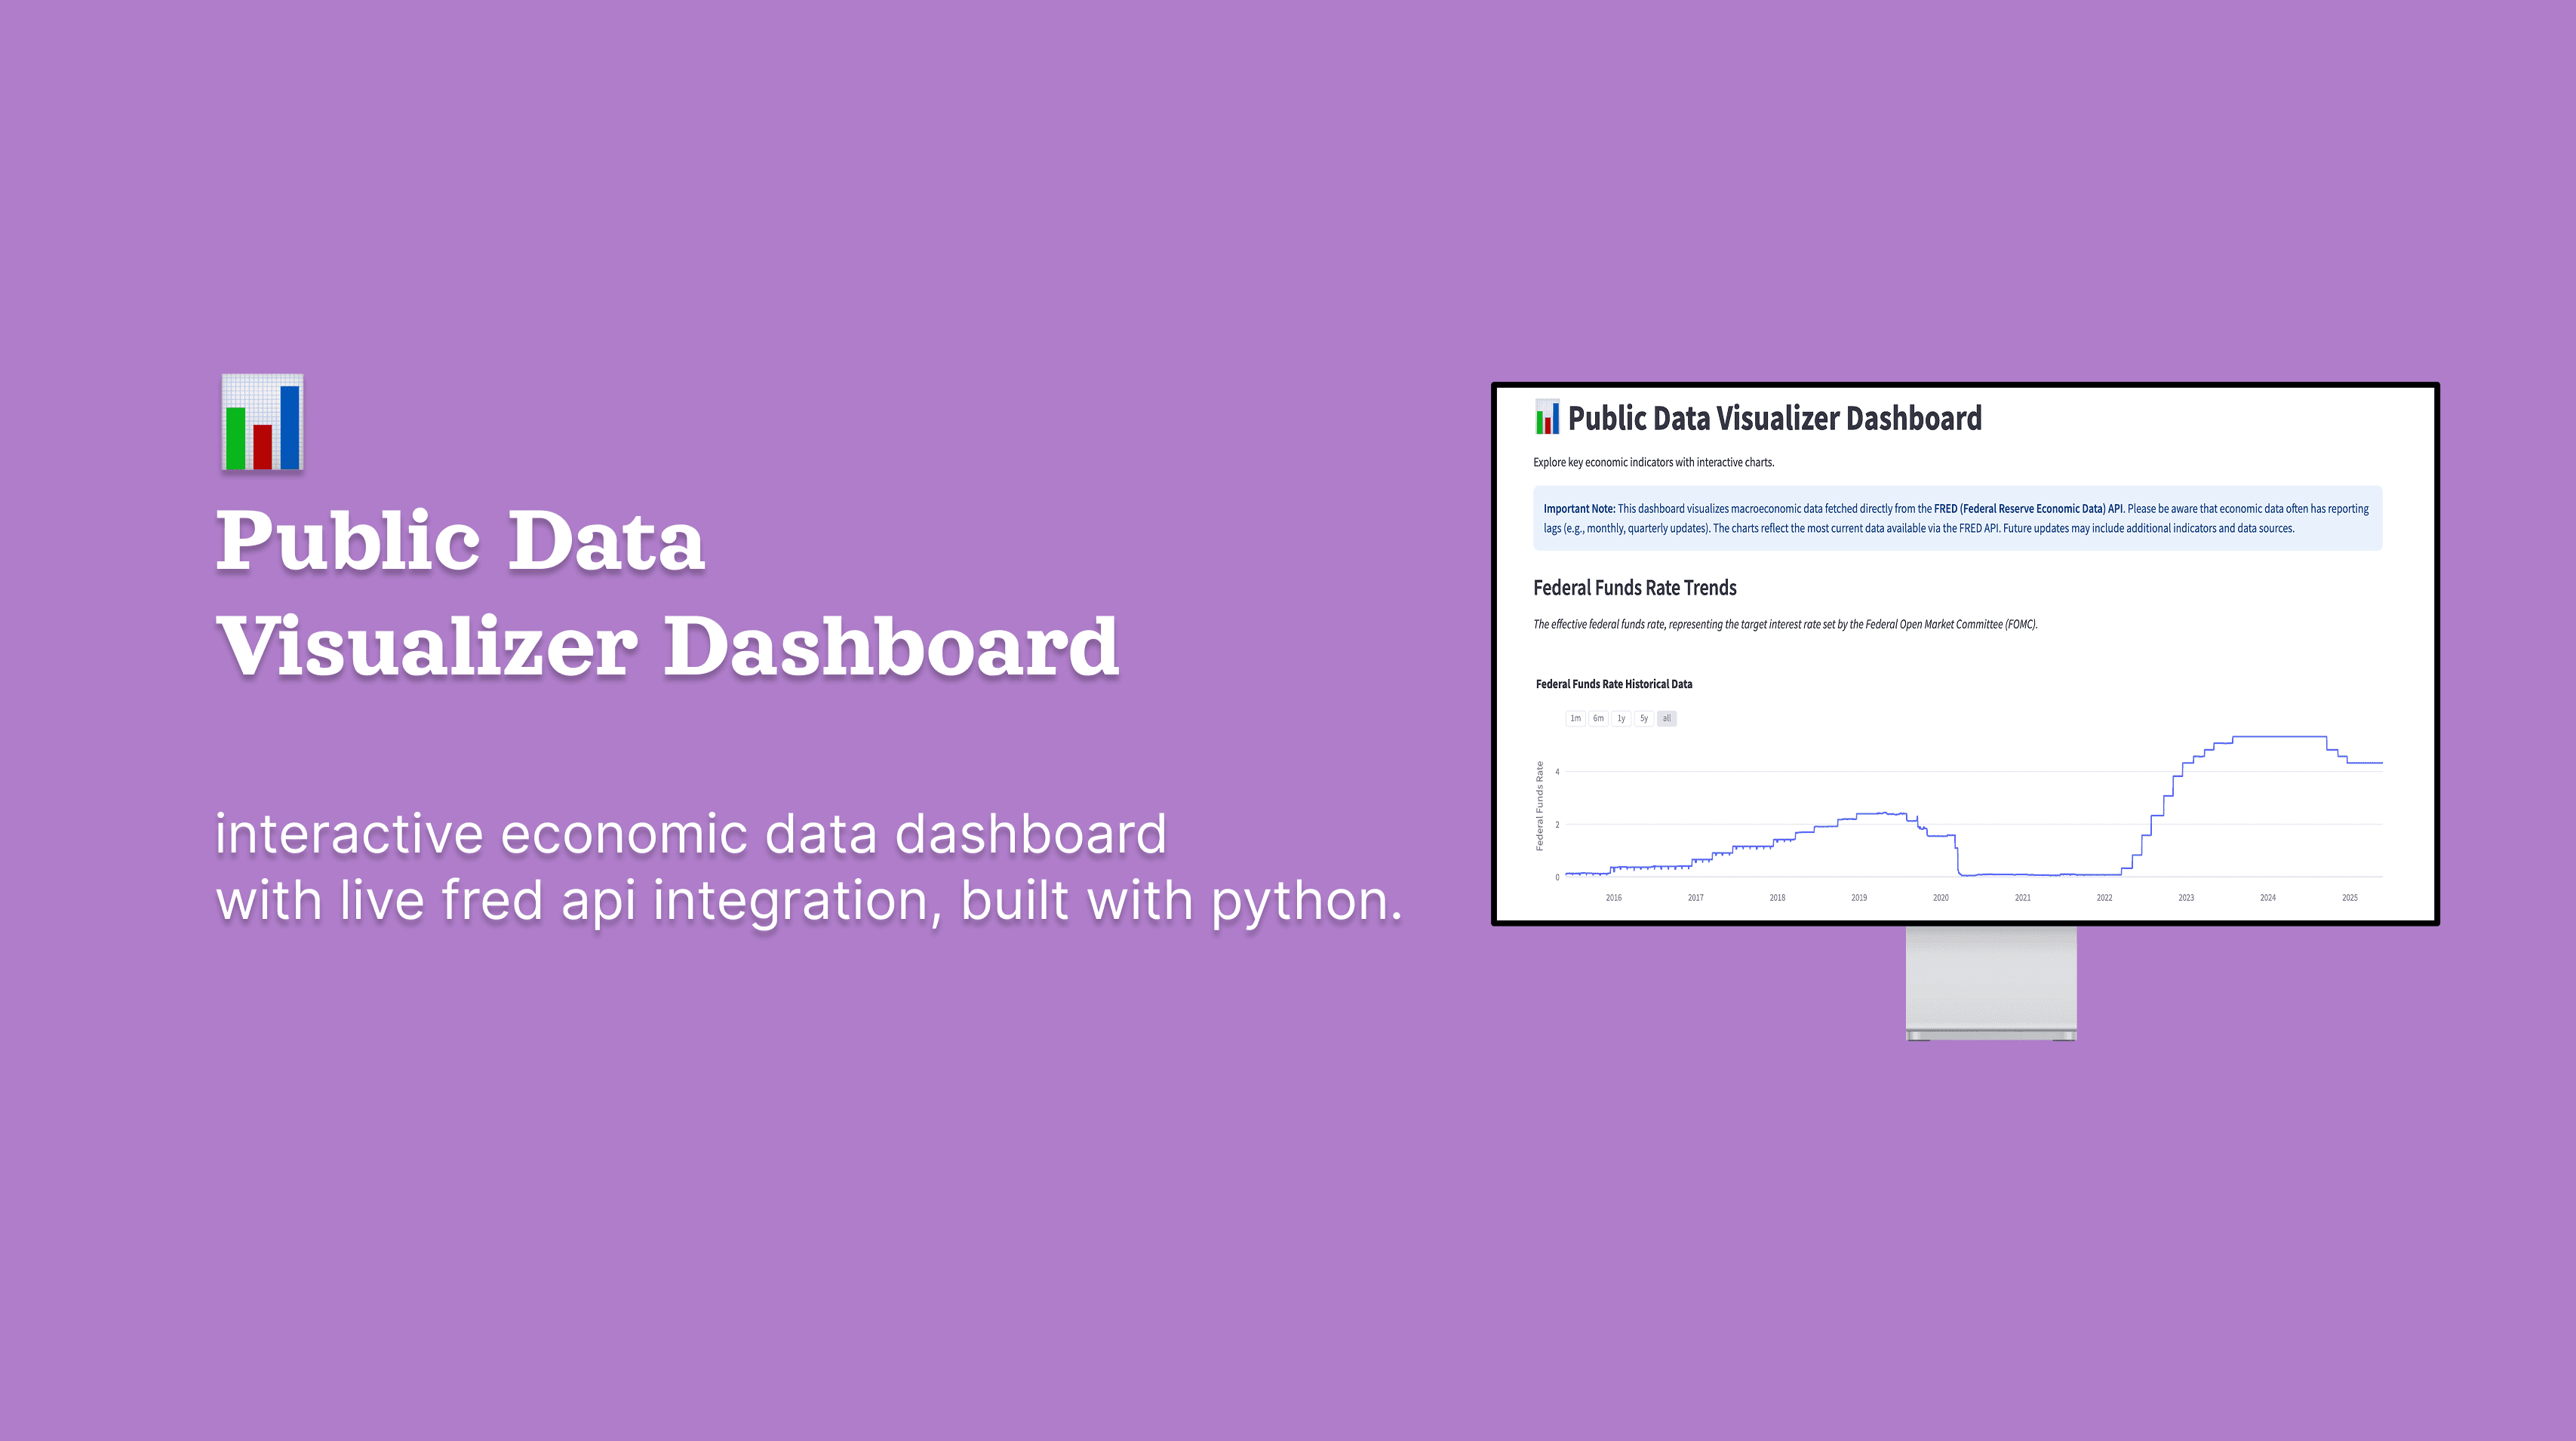
public data viz
Python
overview.
this project is a streamlit-based interactive dashboard that lets users explore key economic indicators sourced live from the federal reserve economic data (fred) api. it empowers users to visualize trends in metrics like gdp, unemployment, inflation, and interest rates through dynamic charts and customizable date filters. the tool aims to make complex economic data accessible and understandable for analysts, students, or anyone curious about macroeconomic trends.
tech stack.
python | streamlit | pandas | requests | plotly express | matplotlib
key features & contributions.
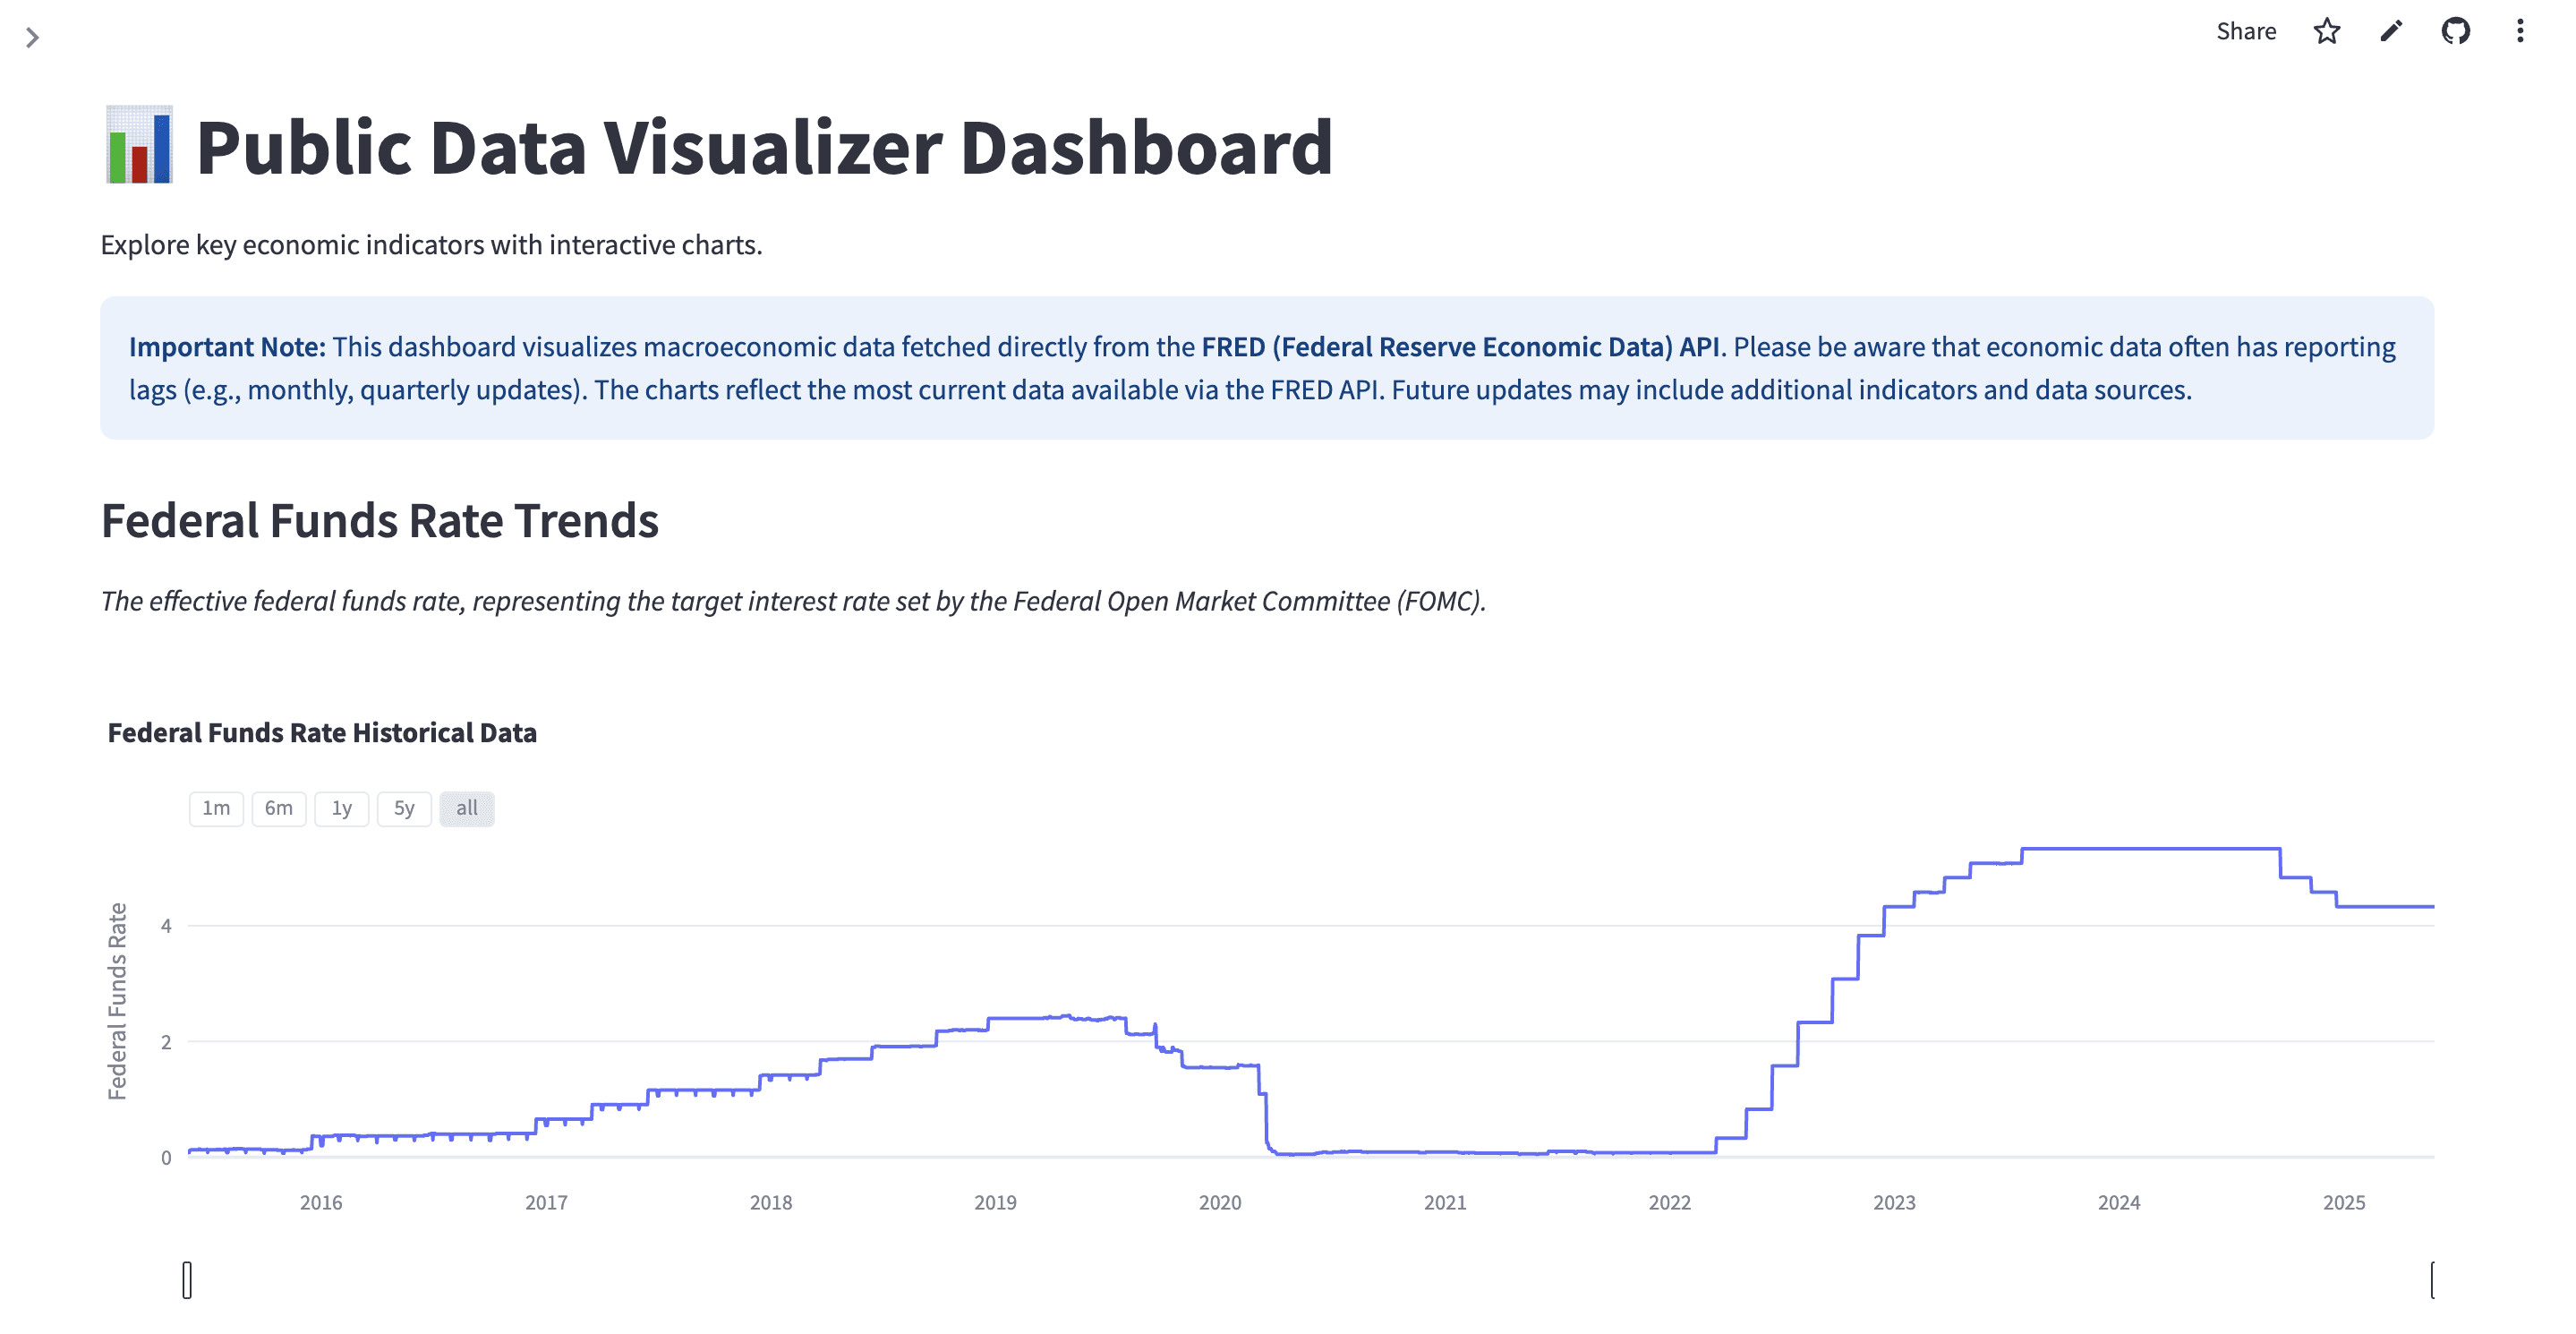
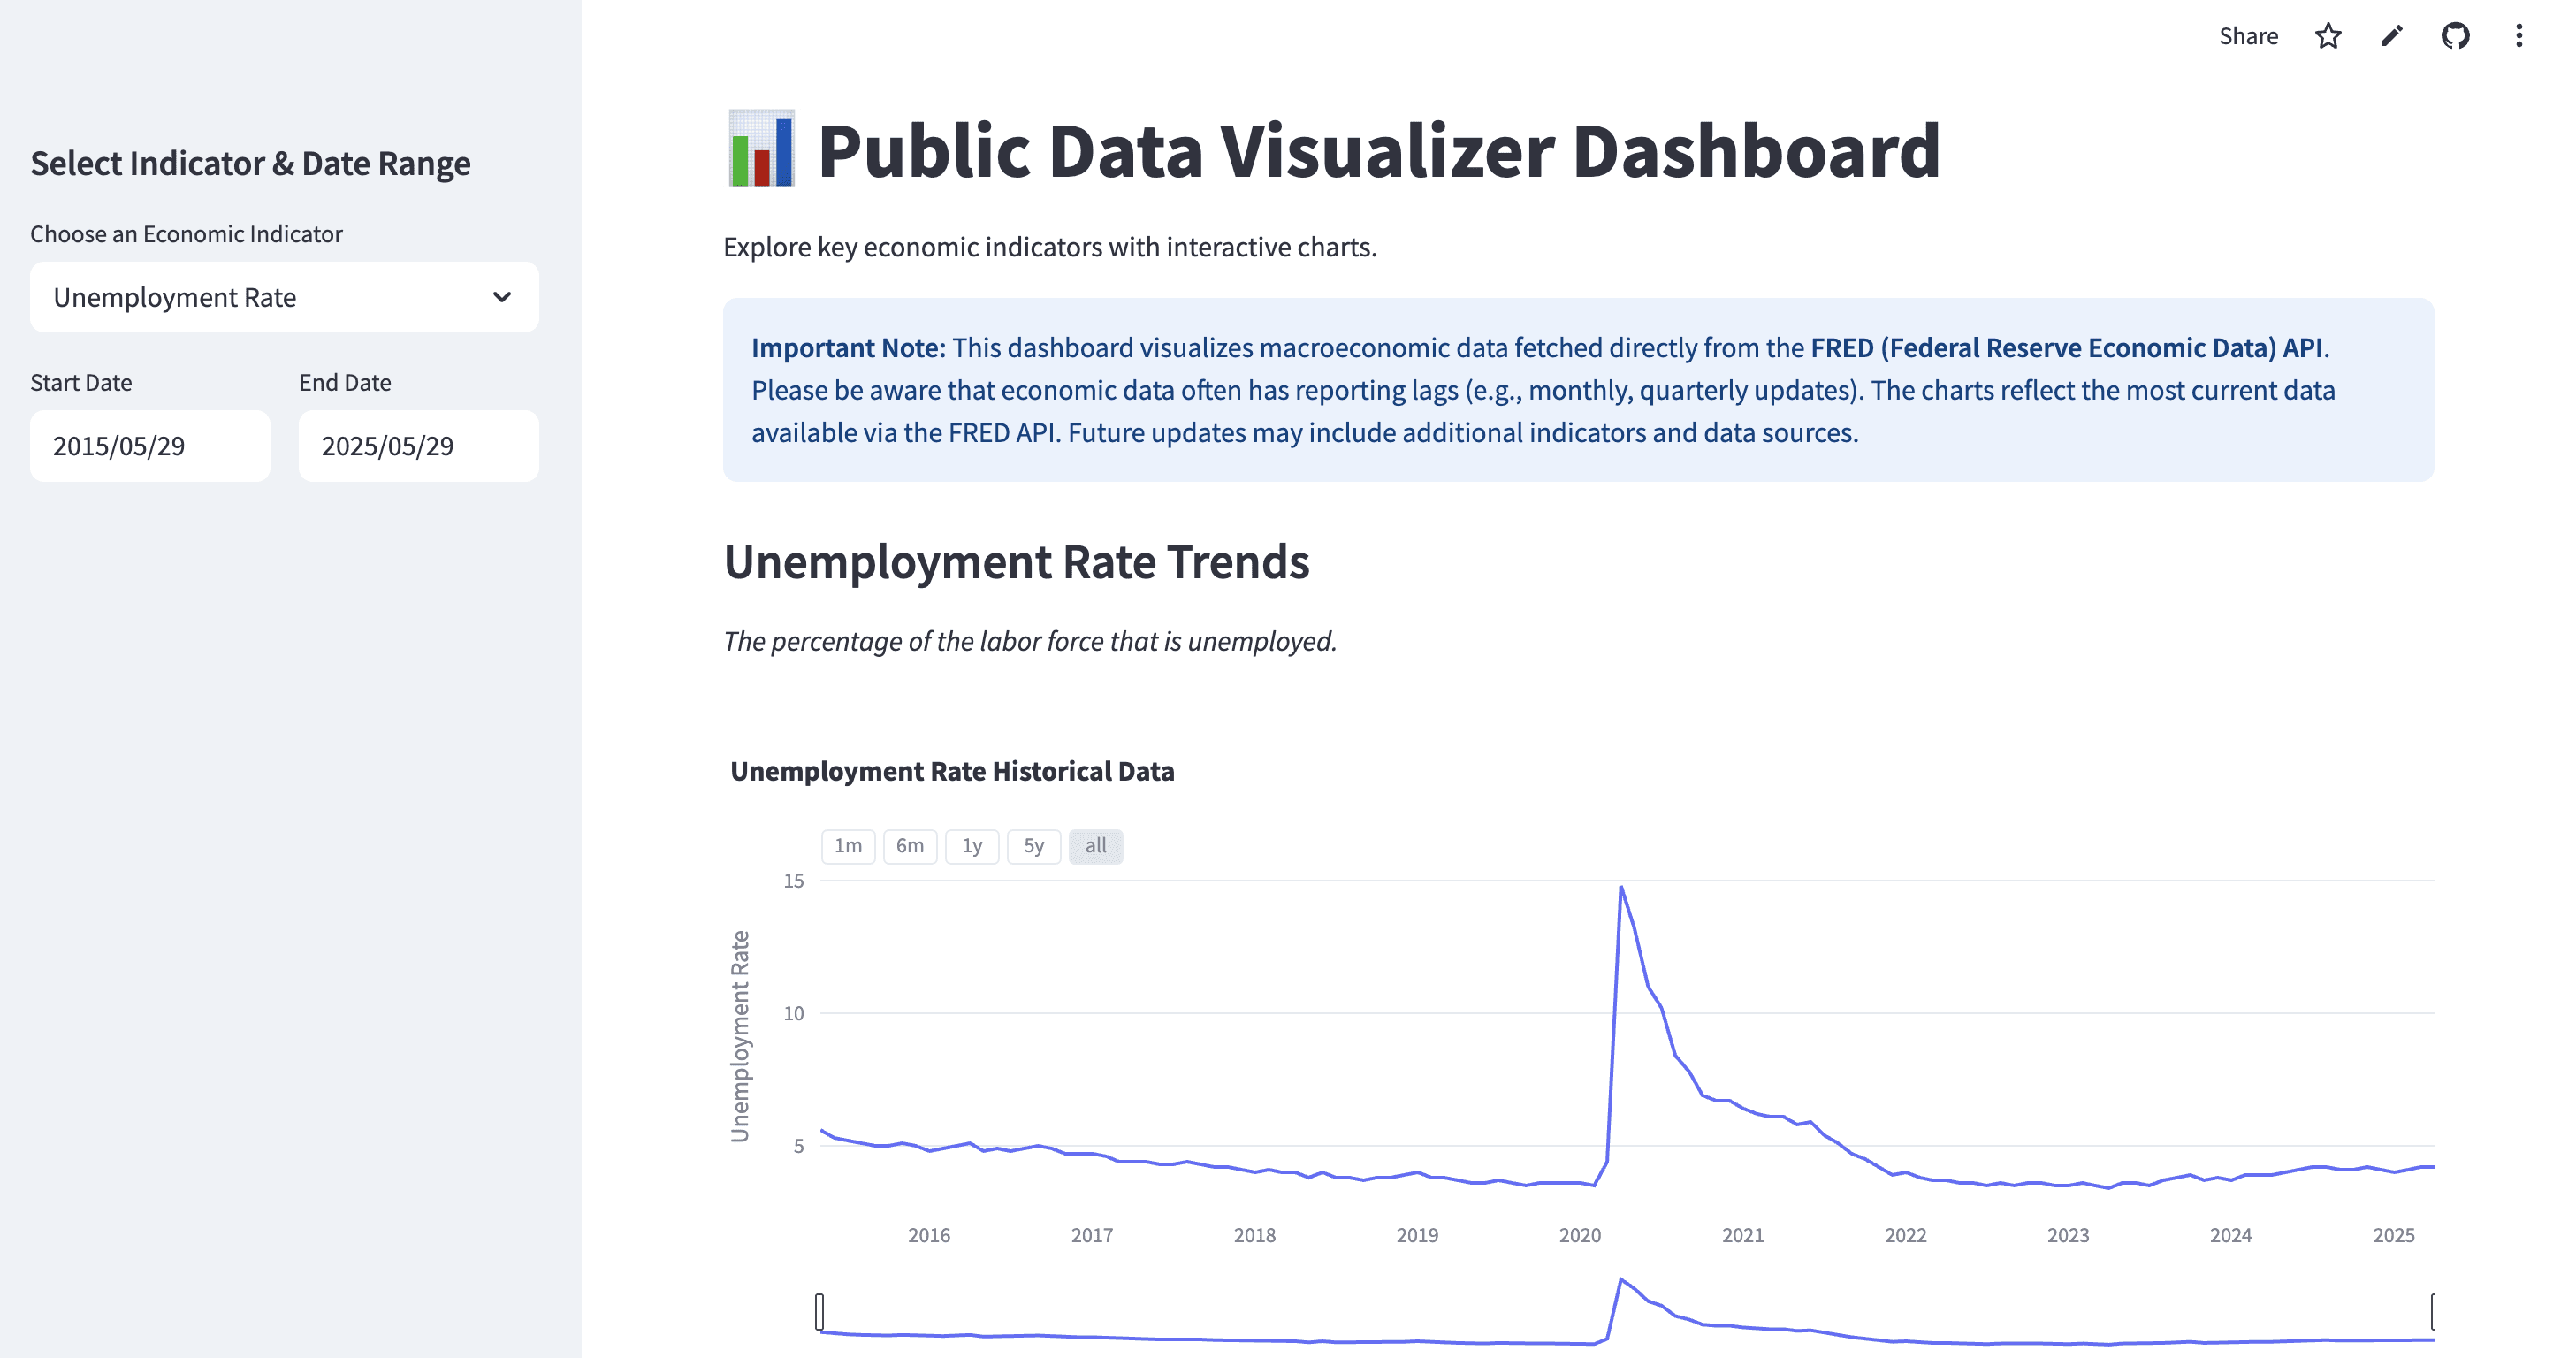
multi-series visualization: select from a curated list of economic indicators including federal funds rate, real gdp, unemployment rate, cpi, and treasury yields
interactive time series plots: dynamic, zoomable line charts powered by plotly express for in-depth data exploration
custom date range filtering: intuitive date pickers to narrow the analysis window
real-time data fetching: live integration with the fred api to retrieve up-to-date datasets
robust data preprocessing: automatic handling of missing values and data type conversions
secure api key management: uses streamlit’s secrets management to keep api credentials safe
informative ui: clear descriptions and source links for each economic indicator
clone & run locally.
git clone https://github.com/belohith/publicdataviz
cd publicdataviz
python3 -m venv venv
source venv/bin/activate # windows: venv\Scripts\activate
pip install streamlit pandas requests plotly matplotlib seaborn
streamlit run app.py
Note: You will need to obtain a free FRED API key from https://fred.stlouisfed.org/docs/api/api_key.html and add it securely in .streamlit/secrets.toml as FRED_API_KEY = "your_api_key_here".